Loop by simmodlr — system dynamics

Find the loop.
Then decide.

Loop is a browser-based system dynamics tool. Model the things that build up and drain away, the rates between them and the feedback that connects them. Run it, find the loop that is driving the result, and share what you found as a simulator anyone can use.

No install · Simulations run in your browser · loop.simmodlr.app

Feedback doesn't fit in a spreadsheet.

Customers, cash, staff, stock, infections: each one builds up over time and changes the rate at which it changes. A row of formulas can describe one step. It can't easily show you what the loop does over years.

And if your question doesn't really involve feedback, Loop will tell you. Its Loop or Excel? check reads the model's equations and says whether a spreadsheet would do the job, and why.

Built-in help. Your own tools.

Loop can draft a model with you, explain it back to you, and check it. Prefer your own AI assistant? Connect it.

✏️

Build with Loop

Describe the system in plain language and review the draft before anything changes, or let a guided interview build it one question at a time.

💬

Understand with Loop

Ask how a value is calculated or what feeds it. Answers come from the model's own structure, and asking never changes the model.

🔓

Use your own AI tools

Connect an assistant such as Claude through Loop's MCP server to build, run, test and document models. It runs on your own computer over plain model files.

Design. Run. Understand. Share.

One model, from the first sketch to the simulator you hand to a client.

✏️

Design — several ways into the same model

Every editor works on one shared model, so you can switch between them at any time.

Describe & Interview
Plain-language drafting
One question at a time
Review before it touches the model
Draw
Classic stock-and-flow notation
Sub-models you can collapse
Automatic layout
Edit & Define
Spreadsheet view of every variable
Forms, lookup curves, subscripts
Units checked as you go
Import
XMILE (Stella, Insight Maker)
Vensim .mdl (scalar models)
An import report before anything is created
▶️

Run — experiments, not just a chart

Move the sliders, save scenarios and compare them side by side.

Euler and RK4 integration
Sensitivity sweeps and two-way grids
Monte Carlo with percentile bands
Fit to data and calibration
🔍

Understand — which loop is in charge

Loop finds the feedback loops, labels them reinforcing or balancing, and shows which one drove the run, and when.

Loop detection and polarity
Loop dominance over the run
"How this works" for any variable
Ask questions about the model
✅

Check — evidence you can show

Four separate verdicts instead of one score: is it sound, robust, substantiated and readable?

A test suite stored with the model
Step-size and extreme-condition checks
Evidence and assumptions on every element
Reproduce any saved run

An epidemic, from structure to behaviour.

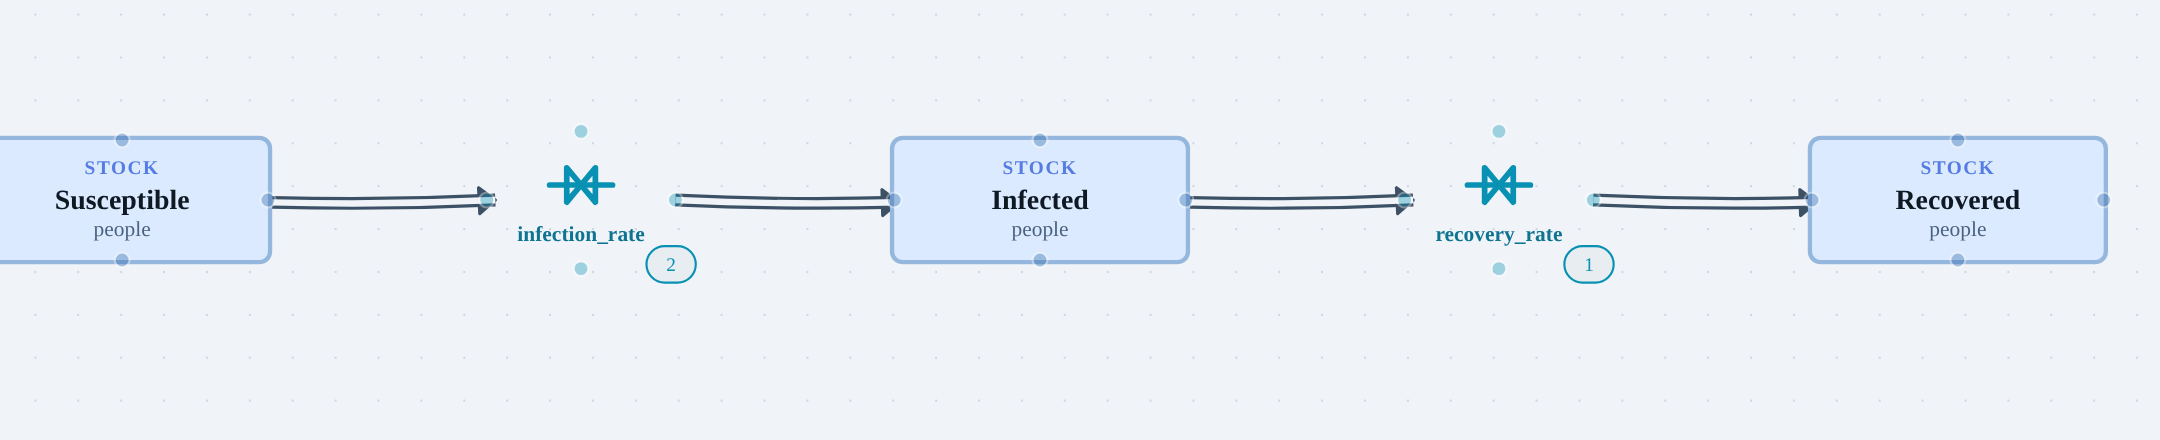
The classic SIR model is one of Loop's built-in templates. Three stocks of people (susceptible, infected and recovered) and two flows between them.

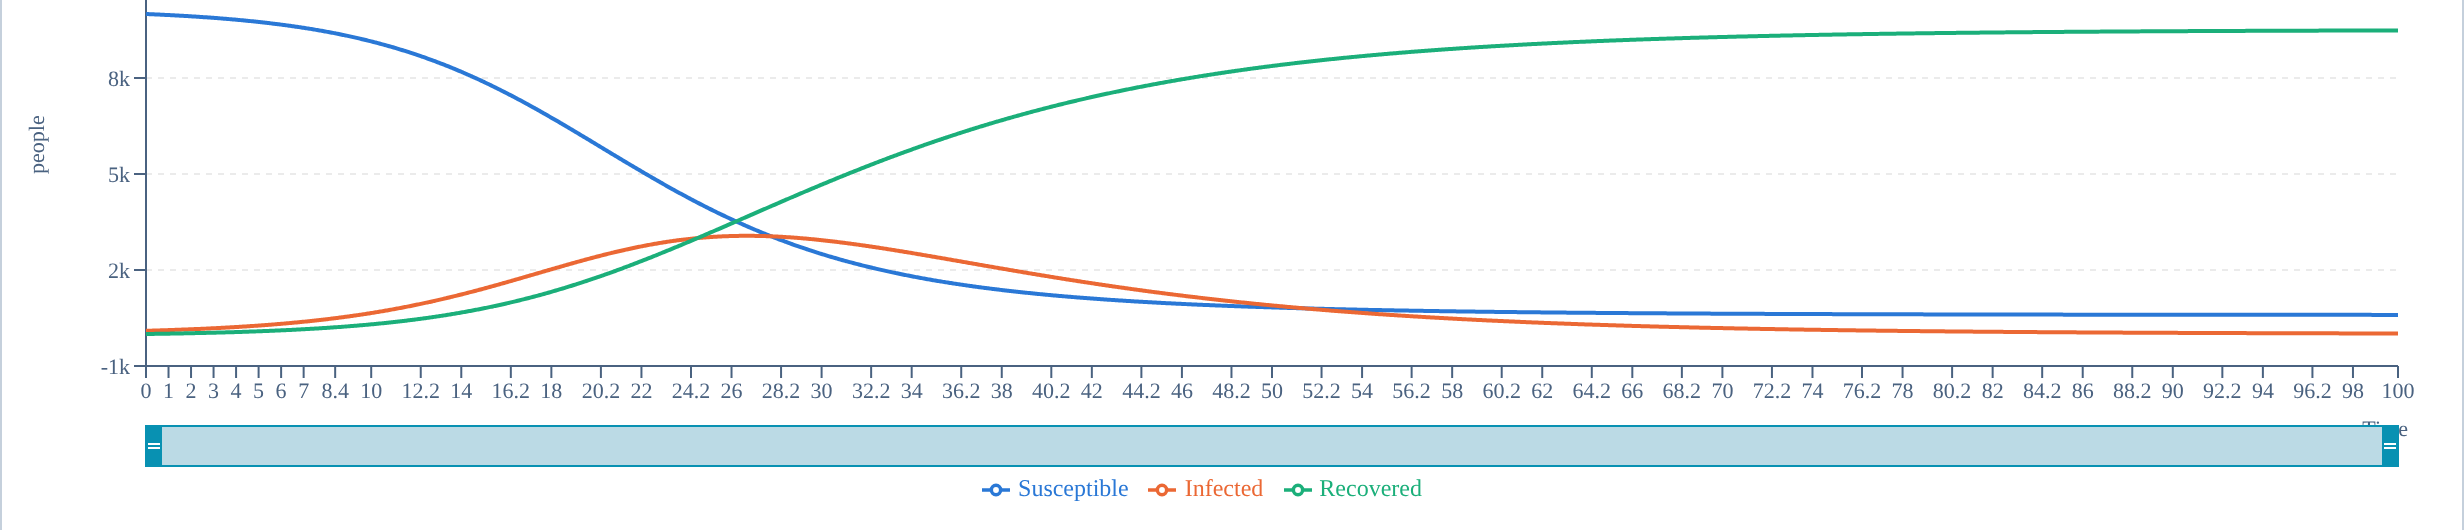
Run it and the feedback shows itself: infection grows on itself until the susceptible pool runs low, then the balancing loop takes over and the outbreak burns out.
✏️DesignStocks, flows and the equations behind them
▶️RunSimulate forward and watch the curves form
🔍UnderstandSee which loop drives each phase of the run
🌐SharePublish it as a simulator with your cases
01 — Design
Loop's Draw canvas showing the SIR model: Susceptible, Infected and Recovered stocks connected by infection_rate and recovery_rate flows
The structure, in classic notation

Stocks are boxes, flows are pipes with valves, and clouds mark where material enters or leaves the system. Switch the view to add the auxiliaries, constants and causal links behind each flow.
02 — Run
Loop results chart for the SIR model over 100 weeks: susceptible falls, infected rises to a peak and falls, recovered rises and levels off
The behaviour that structure produces

The infected curve peaks as the susceptible pool runs down. Change the transmission rate on a slider and the peak moves straight away; save each setting as a scenario to compare later.

Simple to start. Readable when it grows.
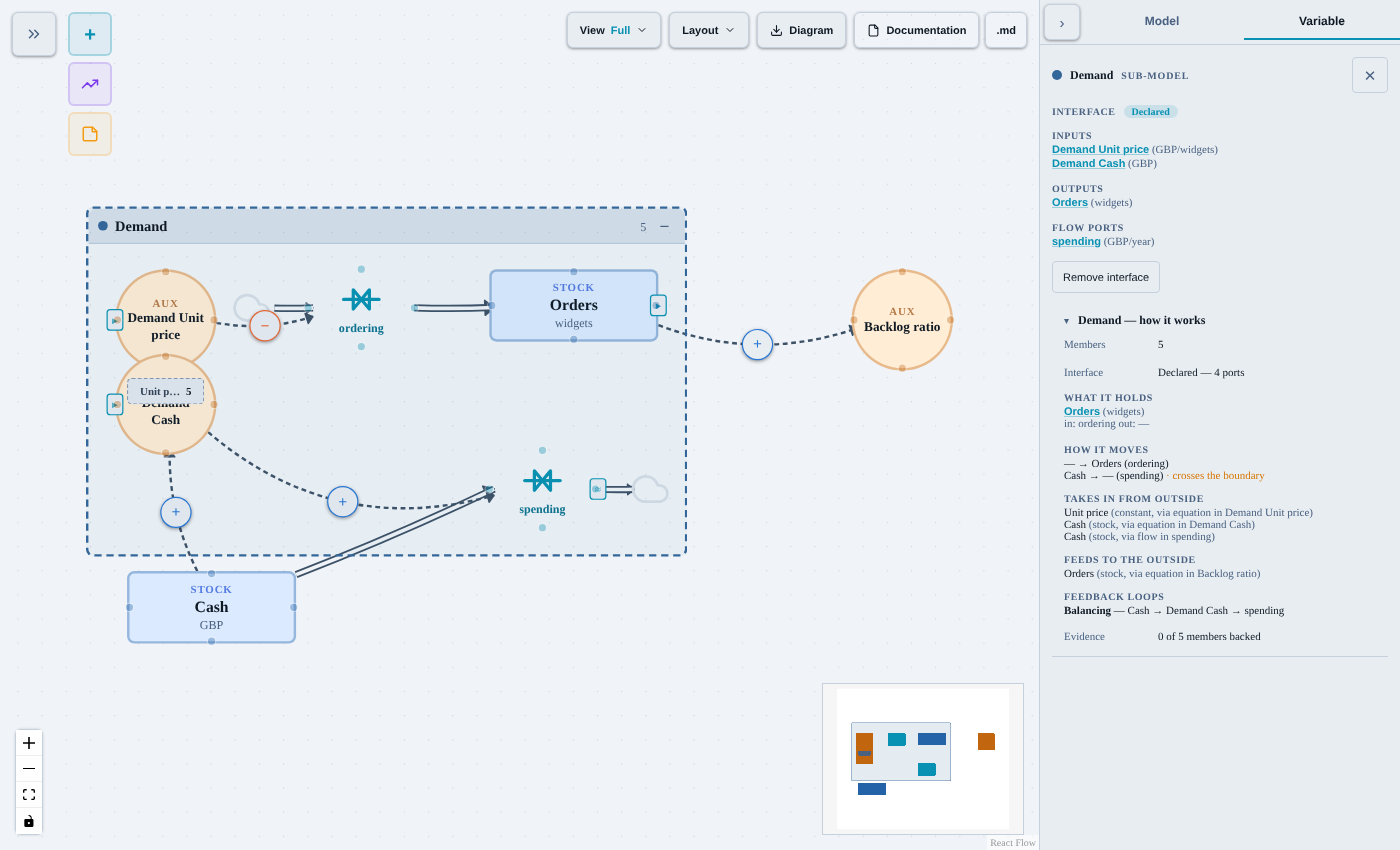
Sub-models with a stated boundary
A Demand sub-model on the canvas with its inputs, outputs and flow ports listed in the inspector, plus a How it works summary of what it holds, takes in and feeds out

Group a model into sub-models and declare what each one takes in and feeds out. Loop describes how each part works, warns when something crosses the boundary without a port, and can test a sub-model on its own.
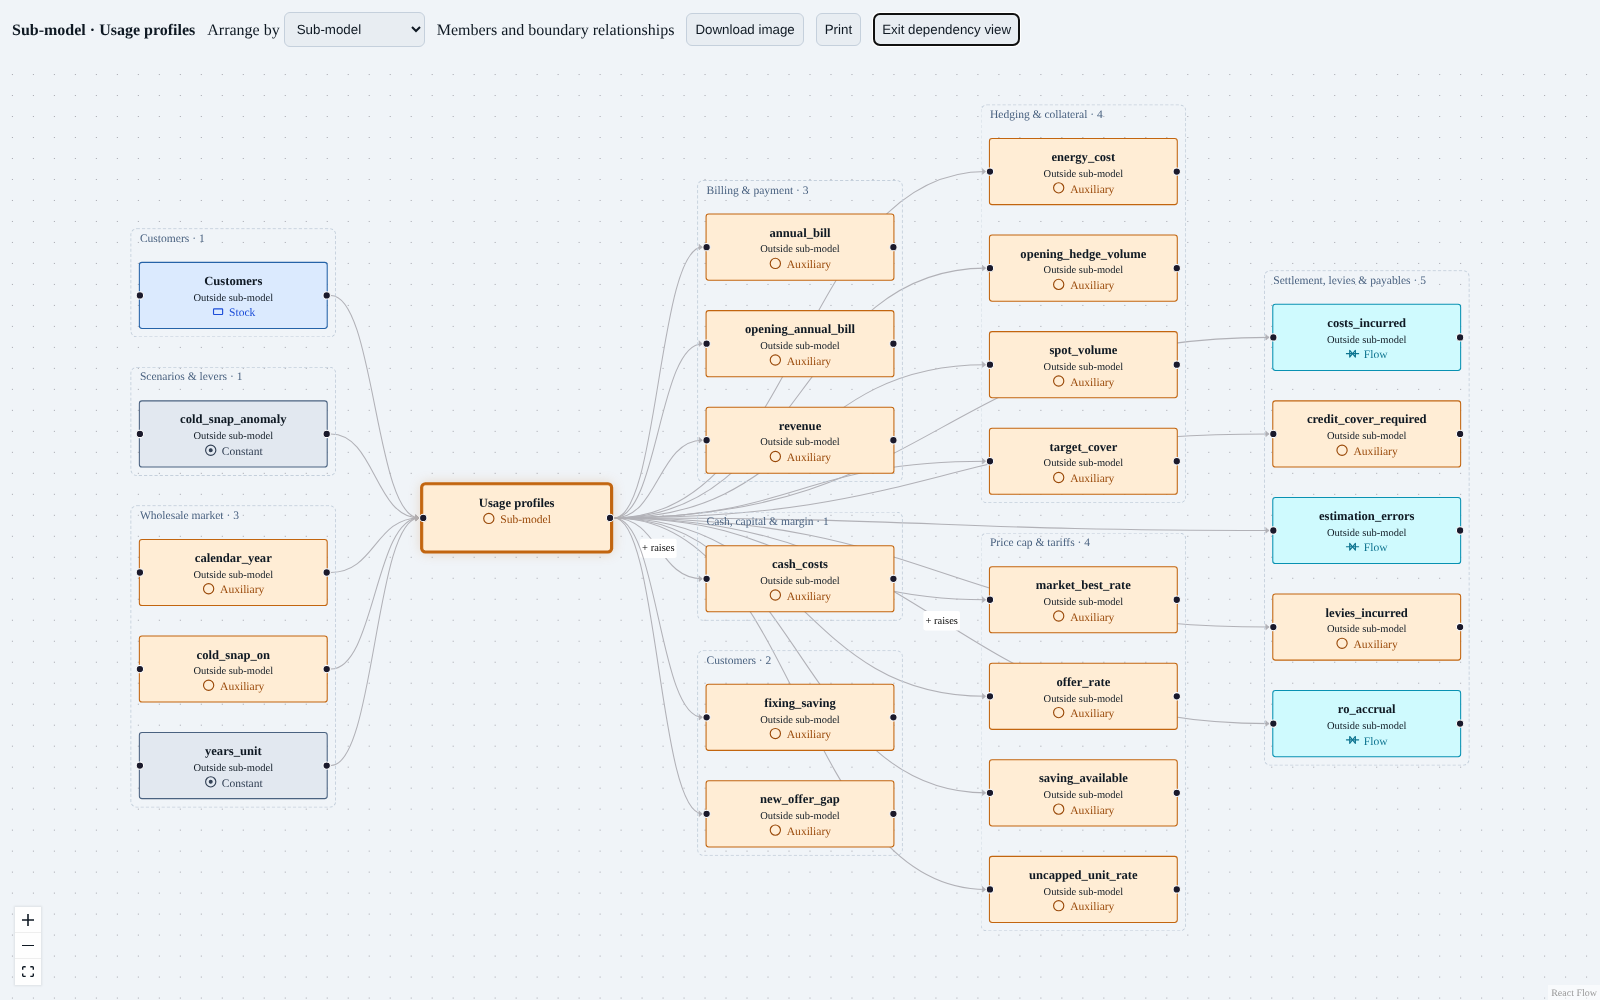
Follow the dependencies
Dependency view of one sub-model in a large electricity supplier model, with the variables it reads and feeds arranged by sub-model

In a large model, pick a sub-model and see everything it reads and everything that reads it, arranged by where it lives. Download it as an image or print it.

Hand over the simulator, not a screenshot.

Publish any model as a public page at a stable link. Visitors don't need an account, and the model runs in their own browser, so they can't change yours.

🎚️

You choose what's exposed

Pick the parameters visitors can move, the outputs they see and the headline numbers. Embed it with an iframe snippet, or switch it off and the link stops working.

🗂️

Your cases, side by side

Publish the scenarios you ran as named cases. A comparison puts them on one chart per output, with a table of which case met which goal.

📄

Documents to take away

Visitors can download the model documentation and the case comparison as PDFs, with the evidence and assumptions included if you choose to share them.

Live example
Heat Pumps Demonstrator

A ten-year model of heat pump installations: households waiting, installers in training, falling costs and grant spending, with four published policy cases to compare. No account needed.

For anyone whose problem changes over time.

You don't need a background in system dynamics. If the thing you care about builds up, drains away and feeds back on itself, Loop is built for it.

"I need to show a client what happens under each option."

Build the model, run the cases, and publish them as a simulator with documentation behind it. The client moves the sliders themselves and sees the evidence for each assumption.

→ Deliver the model, not just the slide.

"We keep fixing this and it keeps coming back."

Recurring problems usually have a loop behind them. Map what affects what, find the loop that keeps restoring the problem, and test where a change would actually stick.

→ Find the loop. Test the lever. Then act.

"I want to learn system dynamics properly."

Start from a classic template, see the stocks and flows, and watch loop dominance shift during a run. Loop explains each variable from the model itself and doesn't hide how it works.

→ No install. No black box.

Questions about Loop

Do I need to know system dynamics already?

No. Describe what you're modelling in plain language and Loop drafts a first version for you to review, or start from one of the templates. The user guide explains stocks, flows and loops as you meet them.

Can I bring models from Vensim or Stella?

Yes. Loop imports XMILE files, including arrays of any number of dimensions, and Vensim .mdl files without subscripts. Before the model is created it shows a report of what it changed, what it left out and what needs your review. Models also export as XMILE and JSON.

Do I have to use the AI features?

No. You can build everything by hand on the canvas or in the forms, and the model checks work with no AI configured. The AI features are there to get you started faster and to explain results.

Can I use my own AI assistant?

Yes. Loop's MCP server lets an assistant such as Claude build, validate, run, test and document Loop models. It runs locally over plain JSON model files, with no account needed and no data leaving your machine. There is also a downloadable prompt pack for chat tools.

Where do my models live?

Models are saved to your Loop account and stay private unless you share them. You can invite named viewers or editors, make a model public, or publish it as a simulator. Every run keeps its own snapshot of the model, so history survives later edits.

What can't it do yet?

Loop doesn't yet read data from Excel, databases or live sources (data comes in as CSV), there is no live co-editing, and integration is Euler or RK4 only. We'd rather say so than have you find out later.

See why it behaves the way it does.

Start from a template or a plain-language description.